SEO reporting —
dashboards tied to revenue
We build Looker Studio dashboards where rankings from GSC, traffic and conversions from GA4, and speed from CWV come together — with daily auto-refresh and smart alerts. You see SEO’s real return without Excel busywork.
Why SEO reports don’t show the whole picture?
1
Manual stitching from multiple systems
Data is scattered across Excel, GSC, GA4 — metrics on different screens with no connections. Hours are wasted just merging numbers.
2
SEO without conversions
Clicks and impressions exist, but their impact on sales or leads is unknown. Budget is spent, ROI invisible.
3
Anomalies go unnoticed
A 20% traffic drop over a week or a spike in indexation errors gets noticed days later. Reaction time is lost.
4
Reports are outdated the moment they’re sent
A static PDF or monthly spreadsheet doesn’t show today’s trends. Decisions are based on yesterday’s data.
What’s included in SEO reporting & dashboards
We build Looker Studio dashboards where rankings from GSC, traffic and conversions from GA4, and speed from CWV come together — with daily auto-refresh and smart alerts. You see SEO’s real return without Excel busywork.
Looker Studio: unified SEO dashboard
One view for organic, GSC, GA4, and CWV — tailored to your KPIs and visual style.
- Page flow: overview → organic → conversions → technical
- Filters by site section, country, and traffic type
- Branding: colours, logo, fonts
GSC: rankings, clicks, and coverage
Query and landing dynamics without manual spreadsheet exports.
- Top queries and URLs with period-over-period trends
- Brand/non-brand slices and CTR anomaly callouts
- Indexation and error signals surfaced clearly
GA4: organic traffic and conversions
Organic traffic linked to goals, events, and funnel stages.
- SEO-focused segments and comparison with paid channels
- Key events and micro-conversions in one block
- Session and source definitions aligned with GSC reporting
Core Web Vitals and page quality
Speed and stability next to SEO metrics — so UX and organic performance stay connected.
- LCP, INP, CLS summary by template or site section
- Tie-in to URLs with the most organic traffic
- A dedicated view for releases and post-deploy regressions
Alerts and anomaly monitoring
Rules for sharp deviations — fewer mid-month surprises.
- Thresholds for clicks, sessions, and ranking shifts
- Notifications on GSC error spikes
- A short “what to check first” guide when an alert fires
Auto-refresh and data hygiene
Refresh schedules and connector health checks.
- Daily refresh by default; higher cadence for critical metrics
- Checklist for access or API changes
- A brief team playbook: what to review every Monday
CRM, call tracking, and external sources
When APIs or connectors exist — leads and deals next to organic performance.
- Field mapping with CRM owners
- End-to-end logic: organic entry → lead → CRM stage
- Privacy boundaries: only the fields and roles you need
Formats for leadership and the SEO team
A compact executive layer plus detailed tables for practitioners.
- 1–2 slides for the “month in a nutshell” for executives
- Tables and drill-downs for weekly reviews
- Optional export or embed link for your reporting stack
Reporting tied to revenue
We connect your sources into one Looker Studio dashboard: GSC, GA4, CWV, and external data when needed. Conversion paths and alerts are configured so you get a live view of SEO and business impact — no coding required on your side.
Single source of truth — All metrics on one screen, logically linked: rankings → traffic → leads → revenue. Data refreshes daily, automatically.
Conversion attribution — We show not just clicks, but SEO’s real contribution: the journey from organic entry to deal — transparent ROI.
Smart alerts — Notifications for traffic drops, GSC error spikes, sharp ranking moves — you learn about issues before they become obvious to everyone.
Flexibility without code — Filters, segments, and metrics in the UI: date ranges, countries, pages — no developer required.
How the work is structured
From scattered data to a working dashboard — in a few aligned iterations.
Step 1
Data & source audit
We check access to GSC, GA4, CWV. We identify which business metrics matter and where they live. Outcome: A list of available metrics and a plan to connect them.
Step 2
Dashboard design
We define structure: key screens, KPIs, filters. We align visuals with your team. Outcome: A dashboard mockup that reflects your goals.
Step 3
Integration & automation
We plug in connectors, formulas, and auto-refresh. We test on historical data. Outcome: A working dashboard prototype with live data.
Step 4
Training, alerts, and handover
We run onboarding, configure alerts, and document a runbook for refresh failures. Outcome: The team uses the dashboard daily; it’s clear where to go when a data flow breaks.
Sample results
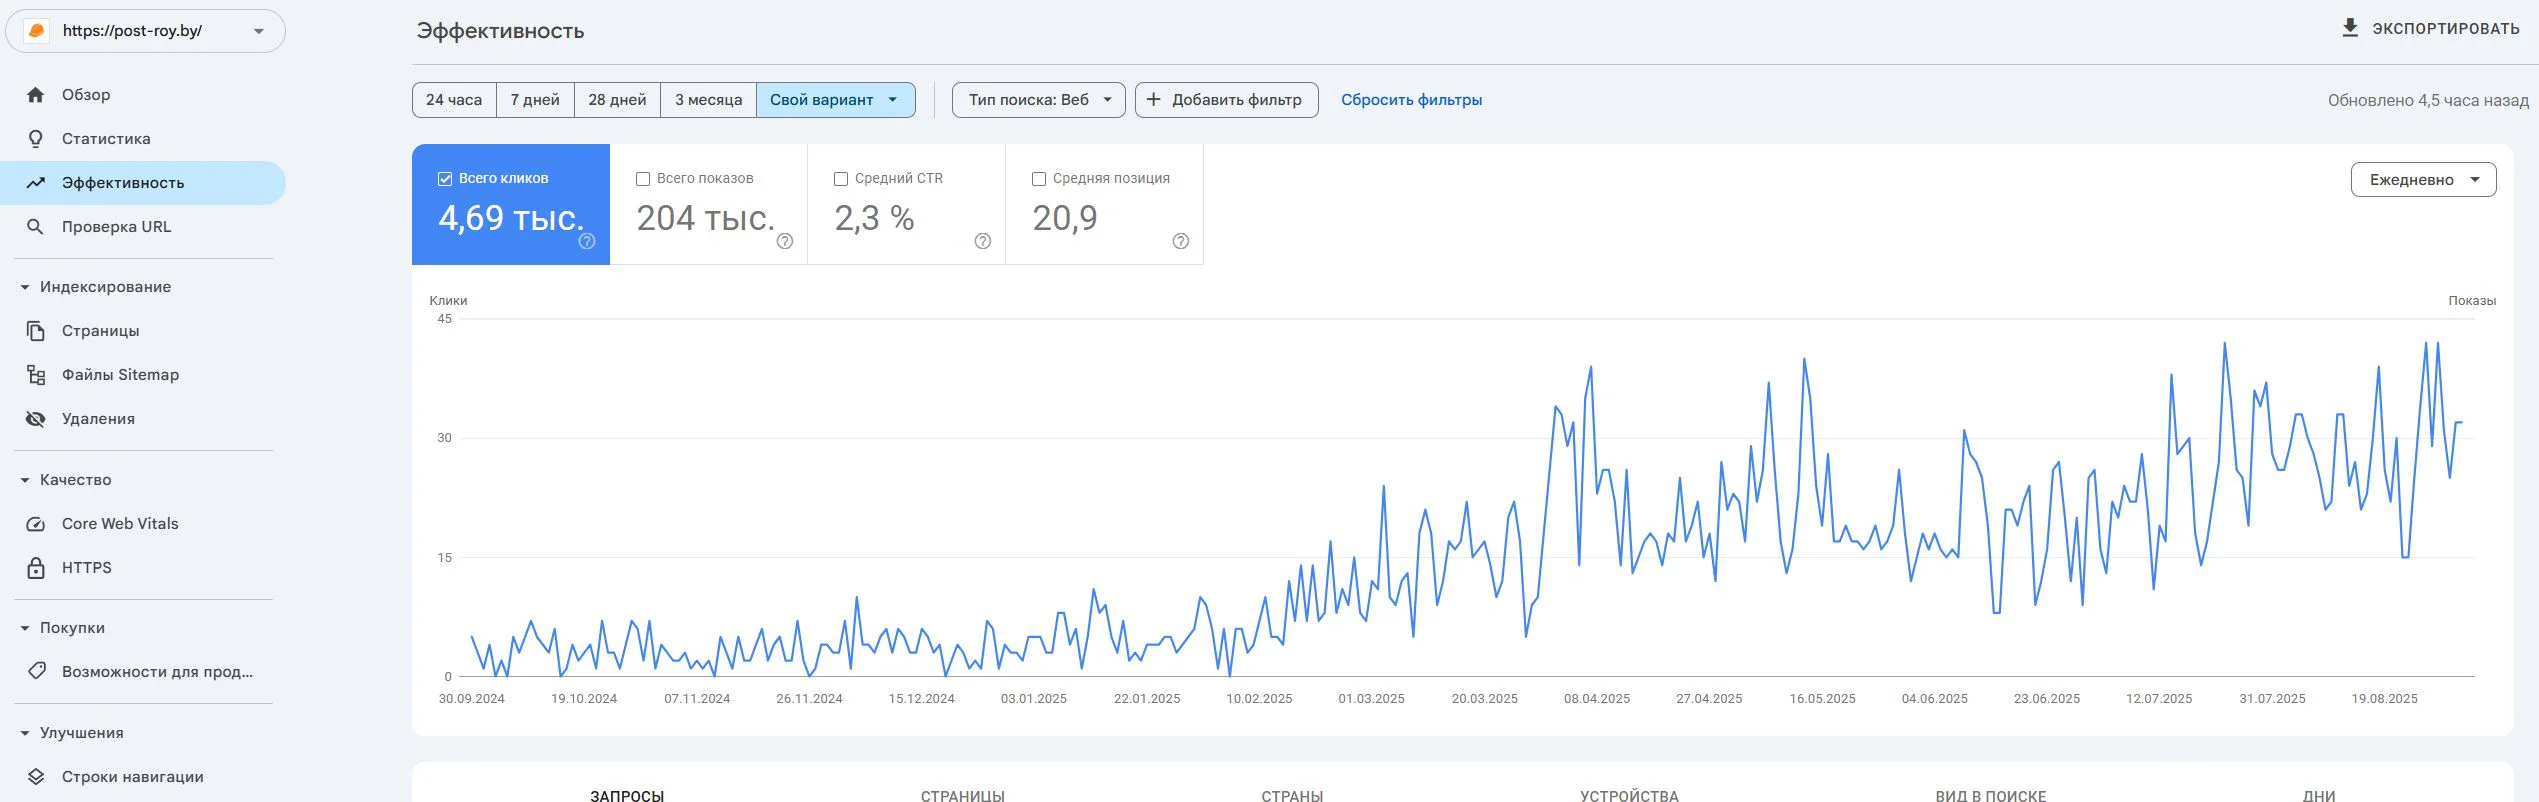
Post-Roy
A construction services website for industrial floors and screed. The project started from zero: no site, no domain, no digital reputation.
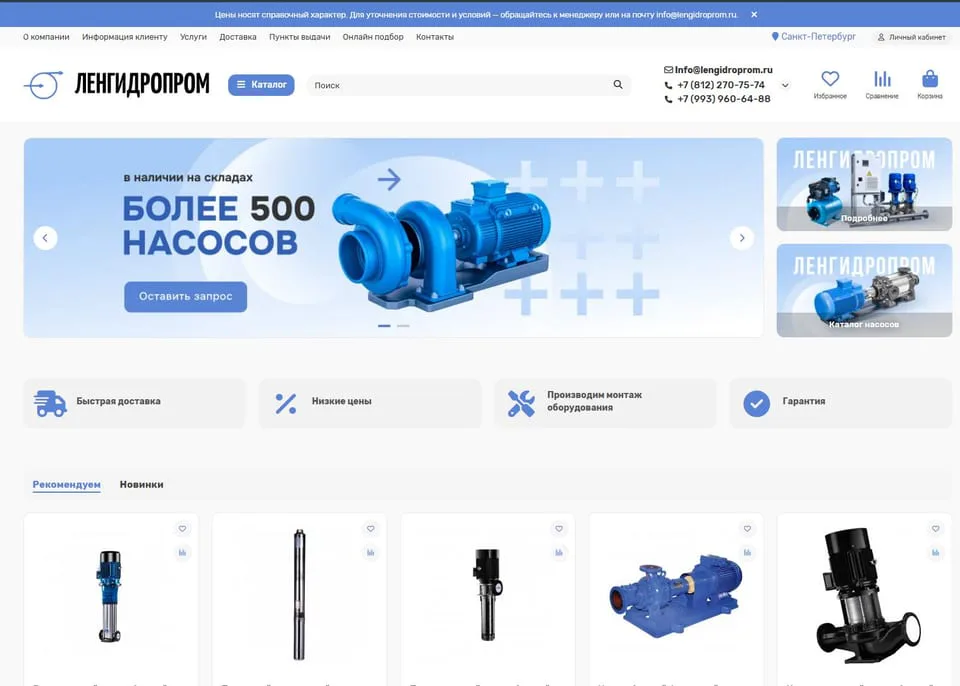
lengidroprom.ru
An OpenCart pumping equipment catalog: template redesign, bot filtering, silo architecture, trust factors and standardization of 3000+ product cards.
Personal
The expert who runs the work
No hiding behind a sales team: priorities, reviews, and straight answers—from strategy through reporting.

SEO Strategist
Pavel Barushka
Head of SEO @ Texode · Minsk / hybrid
SEO strategist with an engineering mindset. I lead projects from zero launch to scaling high-load platforms: JS/SPA, subdomains, multilingual and multiregional websites. Technical audits, indexation strategy, semantics and structured data are in my scope.
Frequently asked
Ready to see the real business impact of SEO every day?
Discuss the dashboard, KPIs, and review cadence — tailored to your team.
Free initial consultation included