Speed & CWV audit —
CrUX in GSC plus profiling: LCP, INP, and CLS traced to root causes and ICE‑ranked tickets
Field data by template and URL first, then lab hypotheses and DevTools. Deliverable: a fix table with expected impact, acceptance criteria, and rollout order — not a generic Lighthouse laundry list.
Why doesn’t a single Lighthouse run explain red CWV in GSC?
1
Blind reliance on Lighthouse
A single lab run doesn’t show the real picture. Without field data (CrUX) optimization becomes guesswork.
2
No clear root cause
Reports spit out dozens of recommendations, but it’s unclear which one will have the biggest impact. Resources get scattered.
3
Negative impact on rankings and conversions
Poor CWV drags down positions and drives users away. Every extra second of load time costs conversion percentage points.
4
Struggles with INP (Interaction to Next Paint)
The new responsiveness metric reveals heavy JavaScript. Your team doesn’t know how to profile and fix long tasks.
What’s included in a Speed & CWV audit
Field data by template and URL first, then lab hypotheses and DevTools. Deliverable: a fix table with expected impact, acceptance criteria, and rollout order — not a generic Lighthouse laundry list.
CrUX & GSC
Group URLs from the CWV report, tie to templates and traffic; separate noise from sustained failures.
- Slices by mobile/desktop and key segments
- Representative URLs per template
- Align spikes with release dates
LCP
LCP element, load priorities, image formats, preload/fetchpriority; chain to first meaningful paint.
- Compression and dimensions without visual loss
- CDN and cache bottlenecks for the LCP asset
- Numeric acceptance targets on pilots
INP & main thread
Long tasks, input handlers, heavy hydration; bundle splitting and deferred work.
- Profile real flows (cart, filters)
- Third‑party weight on the critical path
- JS budgets for commercial templates
CLS
Media and ad reservations, dynamic inserts, font‑display, element‑level shift metrics.
- Slots and aspect ratio for cards and banners
- Fonts without FOIT/FOUT surprises
- Re‑check after content edits
TTFB & infrastructure
Edge cache, origin, Nginx/Apache, DB and heavy aggregations before the first byte.
- Compare TTFB by template and region
- HTML caching where appropriate
- Backend vs network signals
JS bundle
Chunk sizes, unused code, tree‑shaking, code splitting, lazy non‑critical features.
- Costliest modules by coverage
- Routing and shared chunks
- Regressions after dependency upgrades
Render‑blocking
CSS/JS blocking first paint; critical CSS, async/defer, head ordering.
- Inline vs files — weighed against CLS risk
- CSP compatibility where enforced
- Re‑measure with throttling
Third parties & tag manager
Analytics, chat, A/B: weight, load order, consent, impact on INP/LCP.
- Server‑side vs client for key tags
- Triggers and noisy first‑screen firing
- Marketing alignment without losing data
Engineering audit from field data to actionable tickets
I tie GSC Core Web Vitals reports to real page templates, profile in Chrome DevTools, identify root LCP/INP/CLS elements, and produce a fix table with ICE priorities. The result isn’t a list of suggestions — it’s a ready‑to‑implement spec.
Field data as the single truth — I extract and group URLs from GSC’s CWV report, map them to templates and traffic. Lab data only serves as hypotheses.
Deep profiling — I trace the LCP element and request chain, uncover long tasks behind poor INP, and pinpoint CLS shifts. One root cause per group — not a dozen minor tips.
ICE prioritization — Every fix gets an Impact / Confidence / Ease score. The team sees where to start for maximum improvement.
Ready‑to‑use tickets and acceptance criteria — I write tasks for frontend, backend, and CDN with measurable goals tied to field data metrics.
How the audit is conducted
Three steps from raw data to development‑ready tasks.
Step 1
Data
Pull CWV reports from GSC, group URLs by template and traffic. Supplement with lab snapshots via PageSpeed API and Lighthouse as hypotheses. Outcome: A set of representative pages with real and lab metrics.
Step 2
Root Causes
Profile in Chrome DevTools: build the LCP chain, analyze the main thread and long tasks, examine network waterfalls and layout shifts. Pin one root cause per page group. Outcome: A diagnostic map showing exactly what drives each metric over the threshold.
Step 3
Fixes
Create a fix table with ICE priorities. Each fix includes a description, expected impact, and acceptance criteria. Ready‑to‑use ticket wording. Outcome: A ranked optimization plan that can be handed directly to the development team.
Sample results
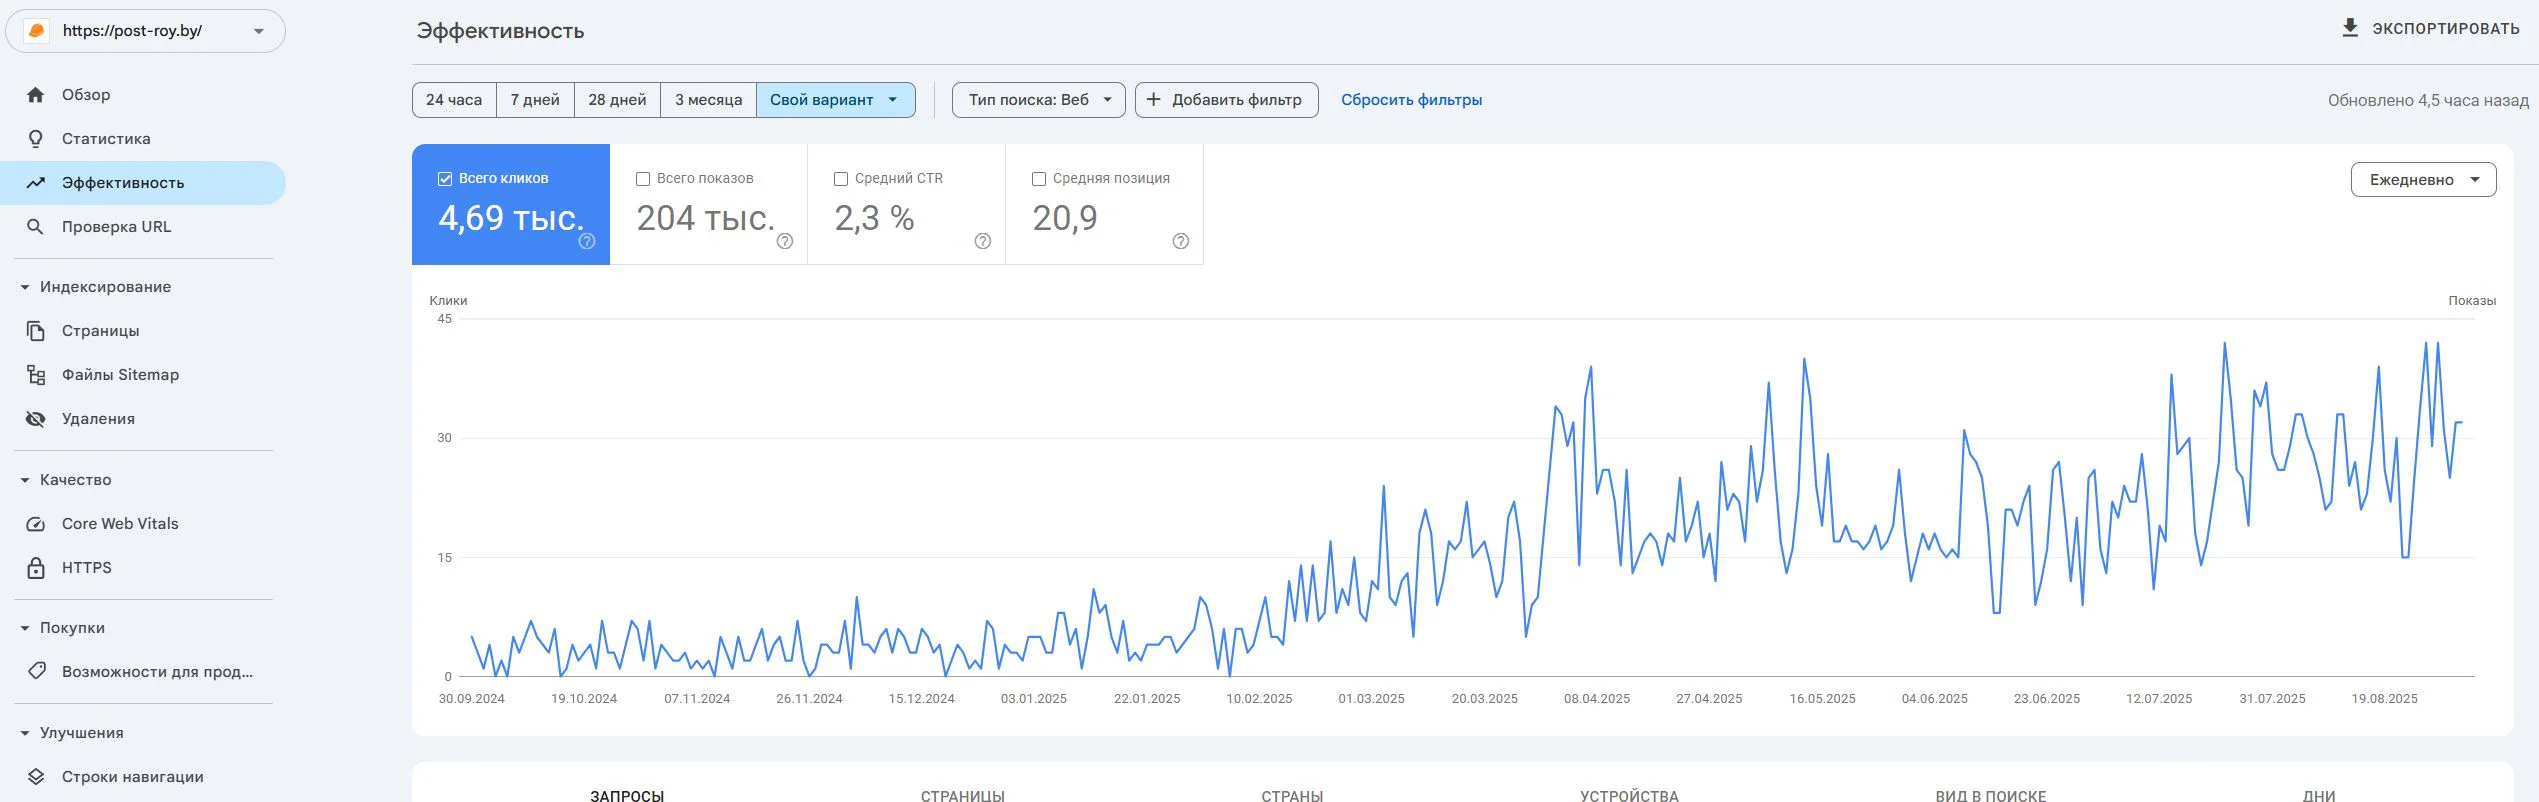
Post-Roy
A construction services website for industrial floors and screed. The project started from zero: no site, no domain, no digital reputation.
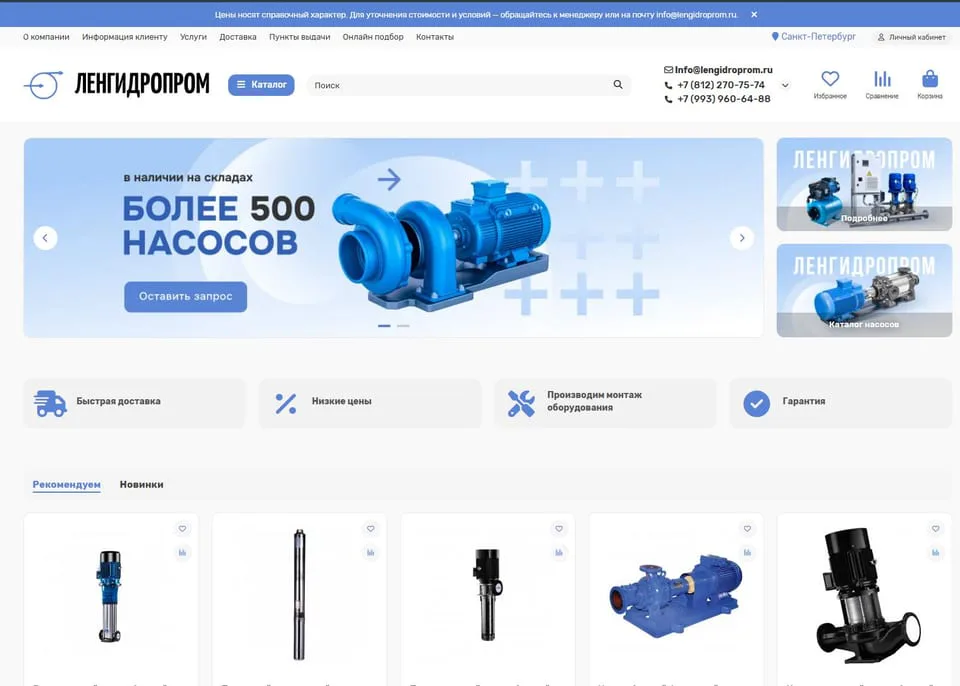
lengidroprom.ru
An OpenCart pumping equipment catalog: template redesign, bot filtering, silo architecture, trust factors and standardization of 3000+ product cards.
Personal
The expert who runs the work
No hiding behind a sales team: priorities, reviews, and straight answers—from strategy through reporting.

SEO Strategist
Pavel Barushka
Head of SEO @ Texode · Minsk / hybrid
SEO strategist with an engineering mindset. I lead projects from zero launch to scaling high-load platforms: JS/SPA, subdomains, multilingual and multiregional websites. Technical audits, indexation strategy, semantics and structured data are in my scope.
Frequently Asked Questions
Ready to bring your site back to the green zone and stop losing traffic?
Field CWV, profiling, and an ICE‑ranked fix table — ready for the dev backlog.
Free initial consultation included